Data Processing 


E3P is a European-funded project aiming at providing relevant climate indices for energy providers. In order to calculate these indices, we are using the ENSEMBLES, CORDEX, DRIAS and CMIP5 data bases.
This document describes the processing chain that allows transforming the raw data of these projects through the data correction by observations into relevant multi-models indices for energy providers.
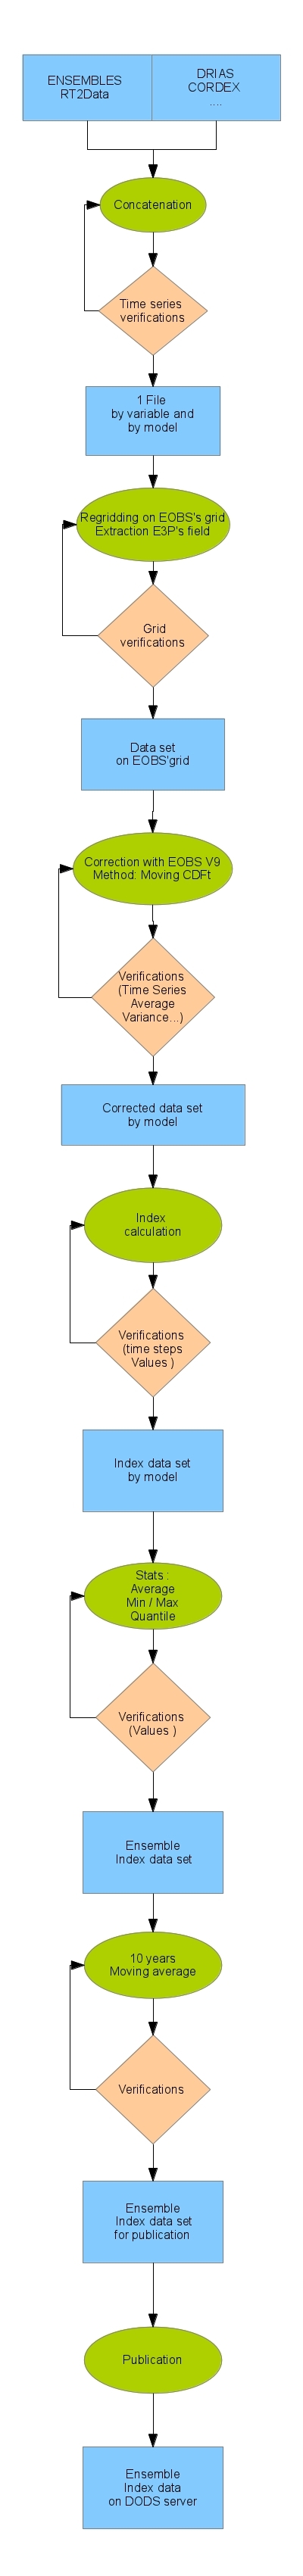
To do so, the raw data goes through different steps:


Data Processing
Step 1 : Preparation of the data

After the download of the files from the different projects, creation of a file per variable and per model concatenating the files (nrcat).

Result: one file per variable and per model for the entire studied period.
Step 2: Extraction on a common grid

The extraction on a common grid is specific to each project.
For ENSEMBLES, each model has its own grid. Models are regridded on the EOBS grid using the nearest neighbor (cdo remapnn). Extraction of a common domain to all models (ncks).
For CORDEX, the models are already on the same grid so there is no need for regridding. The extraction can be directly realized in a common sub-domain to ENSEMBLE.

Result: a data set on a common grid.
Step 3: Data correction

The correction of data allows correcting the biases of the models through observations.
It also provides the possibility of downscaling. The data correction methodology used is CDFt (Cumulative Distribution Function Transform), a quantile to quantile methodology.
The used version allows doing a moving correction. This moving correction is applied in two different ways:
Monthly: use of the distributions (CDFs) of January, February and March to correct February.
Annually: use of a 21 years period distribution (CDF) to correct 11 years.
CDFt is applied 12 times to correct the 12 months on an 11 year period and on each following 11 years.
CDFt is applied by an R script.
The data correction uses the EOBS observations to correct the 1971-2090 models period. The daily mean temperature, daily minimum temperature, daily maximum temperature and precipitation are corrected.

Result: 1 file corrected per variable and per model
Step 4: Calculation of the indices per model

Calculation of the indices climate indices for energy providers from the corrected data: The indices are calculated either from scripts using the commands CDO (cdo timeselmean, cdo monmean, etc.) either from R scripts (Calculs_indices_RT2_hiver.R, Calculs_indices_RT2_ETE.R, etc.)

Result: one file per index and per model.
Step 5: Calculation of the multi-model indices

Calculation of all models mean and of the model's envelope (minimum / maximum):
Script of CDO commands: cdo ensavg , cdo ensmin and cdo ensmax.
Gathering in one unique file of the envelope (minimum / maximum) and of each index mean (cdo merge).

Result: one file per index, each file containing the mean, minimum and maximum of all models.
Step 6: Moving average

In order to keep a statistical evolution of the climate, a moving average on 10 years is done as well as a check of the metadata and time axis.

Result: a database of multi-model indices
Step 7: Data publication

The multi-model indices files are made available on a DODS server through a web link.

Result: a database of multi-model indices available through a DODS server